You can build a Beyond 20/20 table from comma-separated values (CSV) source files.
This exercise shows you how to create a table from an CSV source file. We will open a CSV source file, describe its source fields, define a series, position the dimensions, and then build and document the table.
- Before you begin, unzip the files in the attached .zip file to a folder, Example1FilesToBuildTableFromCSV.zip
This Example contains a file that looks like this:

Where Année represents the year of the data and columns 1, 2, 3, etc. represent regionalcolumns containing numeric data that should be displayed in the cells of the table (IVT) being built.
Opening a Source File - CSV
The first step in building a table is to open the source file.
To open the CSV source file:
- Do one of the following:
 Click the Open button on the toolbar.
- From the File menu, choose Open.
The Open dialog box appears.
- In Files of type, select Comma Separated (*.csv).
- In File Name, select Example_1_Build1.csv.
Note: If you do not see Example_1_Build1.csv listed, you can search for it in a different drive and directory.
- Click OK.
An untitled, empty table view appears.
 Now you can set the field information for those source fields that are not character or strings.
Setting Field Information
Use to define the treatment of data in a table, and set missing value field information.
- A writable table must be open and one or more fields must have been defined.
To open:
- From the Source menu, choose Set Field Information.
- Press Alt, S, N.
Options:
Source Fields
Displays all the field definitions that are in use in the table.
Select All
Selects all the field definitions.
Select None
Clears all the selected field definitions.
Name
The name of the source field. Click Name to sort the source fields alphabetically by their names.
Type
Shows the type of data that is contained in the source field. Possibilities are Date, Numeric, and Character. Click Type to sort the source fields alphabetically by their types.
Treatment
The treatment of the data in a source field. Click Treatment to sort the source fields alphabetically by their treatments. Default treatments are:
- Dated for Date type information
- Numeric for Numeric type information
- Coded for Character type information.
Start
The starting position of the field information in the source file. Click Start to sort the source fields numerically by their start positions.
Width
The width of the field information in number of characters. Click Width to sort the source fields numerically by their widths.
Treatment
Select Coded, Numeric, Dated, or Ignore to force a source field to use a particular treatment.
Apply
Applies the selected treatment to a source field.
Missing Values
Displays all the missing values that have been defined for the selected fields.
Note: A missing value that applies to one or more of the selected fields but not to all of them displays in normal text, and a missing value that applies to all the selected fields displays in bold text.
Source File Code
Displays the codes for the source file missing values that have been defined.
Missing Type
Displays the missing value types for the defined missing values.
Add
Opens the Add Source File Missing Value dialog box, which enables you to add a new missing value or edit an existing one.
Remove
Deletes the selected missing value from the source information.
To Set the Field Information for the fields in your CSV file:
1. From the Source menu, choose Set Field Information.
The Set Field Information dialog appears:
2. Click Année and then select Dated and then click Apply
Année changes to Dated type in the list:
3. Select columns 1-65 (Select 1 and then scroll down and <Shift><Click> 65) and then select Numeric and Apply.
You will be prompted to confirm that you want to apply this to all fields:
4. Click Yes and then OK
Your Builder screen should now look like this:
You are now ready to provide more information for your Time dimension
How To Define the Periodicity of a Time Series dimension
When you define a source field as a Dated field, this means that you intend this source field to become a Time series dimension. When you do this you need to provide Time series information for the source field indicating whether it is monthly, annual, etc.
To provide this information, right click on the source field and select Source Field Summary.
Source Field Summary View
Displays descriptive information about the active source field.
To open:
- From the Data menu, choose Source Field Summary.
- Click the right mouse button on a source field and choose Source Field Summary.
- Press Alt, T, M.
To Set Periodicity of Source Field, Année:
- Scroll until you see Année in the source field list
- Right click on Année and select Source Field Summary
The Source Field Summary box appears:
- Enter information for the field. Category is used when creating extracts, IVX, and not necessary when creating IVT files.
- Enter a description for the field and make sure Date Field is selected under Treatment and for this file make sure Annual is selected. You can also select yyyy from the Date Format list.

- Click OK after you have entered the information.
You are now ready to group your numeric fields under one name so that each numeric field can be a column in a dimension.
How To Define a Series (Group numeric fields together so that they become items or columns in a dimension)
In some cases, a source file may not contain all the information you need to create a comprehensive table, or the organization or content of the source file may require some modification to produce the desired results. In such cases, you can define custom source fields to help the Builder interpret the source file.
In this exercise we are going to connect the columns labeled 1, 2, 3, etc. so that they can be displayed as one dimension, Region, in the table. This is called ‘defining a series.’
To define a series:
- From the Source menu, choose Define Series.
The Define Series dialog box appears.
- In Series Name, enter a name for the series. (We will use the name Region.)
- In the Source Fields area, select 1.
- Click Add Field. The Define Series Dialog Box will look like this:

- Repeat for the source fields 2 to 65 and click OK.
The new tile Region appears in the source field bar:

You are now ready to position the dimensions in the table.
Positioning Table Dimensions
To create a multi-dimensional table, you must indicate what the dimensions of the table will be and where they will be positioned. This is done by dragging and dropping source field tiles into the row, column, and dimension bar areas of the table view.
It is recommended to drag the Row dimension first, the Column dimension second, followed by dimension on the dimension bar.
It is not recommended to put more than one dimension on the rows or columns. This can be done after building the table.
It is not recommended to release a source field tile over a dimension that has already been defined. Instead, drag the dimension you want to replace back to the source field area before dragging a source field tile to the dimension.
It is not recommended to move dimensions around in the table once you have dragged the source field tiles into the table and before you have built the table. Instead, drag dimensions back to the source field tile area, release, and then drag them back into the table taking care to not release them over a dimension that is already in the table.
To position dimensions:
- Click on the Region source field tile and hold down the left mouse button. Drag the tile into the row dimension area and then release it.
The dimension tile appears in the table view and the Region tile is dimmed in the source field bar.
Similarly, use the following information to position the remaining source field tiles into their corresponding dimension areas:
Source Field Tile | Dimension Area |
Année | Column dimension area |
type d'analyse | Dimension bar |
Groupe d'amérind | Dimension bar |
When all the tiles are positioned in the table view, the table will look like this:

You are now ready to build the table.
Building the Table (Quick tour)
Once you have described your source file and defined and positioned the table’s dimensions, you are ready to build the table.
If the table is to be updated in the future and you want to be able to recreate the build, you should save the update definition. (First you will be prompted to save the source definition.)
To run the build:
- Do one of the following:
 Click the Load data button on the toolbar.
- From the Data menu, choose Go.
- You are prompted to save the update definition. If you choose Yes, a dialog appears saying that there have been changes to the source field definitions so you must first save the source definition file. Click OK.
The Saving the Source Definition File dialog box appears.
- In File Name, enter Example_1_Build1.IVS and click OK.
The source file attributes are recorded and saved in the source definition file, Example_1_Build1.IVS, and the Save As dialog box appears so you can save the update definition.
- Enter a name for the update definition file and click OK.
Data from the source file is loaded into the table according to your specifications. An information box displays statistics on the build (the number of records logged and ignored, and the number of datapoints added).

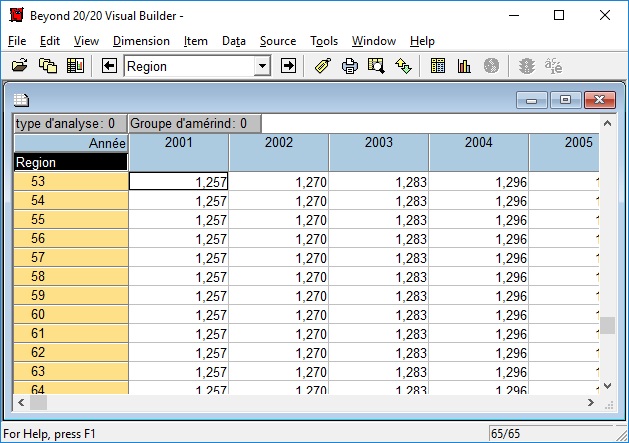
The Builder now shows data in the cells as follows:
You are now ready to name and save the table.
Naming and Saving the Table
Once a table has been named and saved, any further changes made to it are saved automatically. We will name and save this table as Example_1_Build1.IVT.
To name and save the table:
- From the File menu, choose Save As.
The Save As dialog box appears.
- In File name, enter Example_1_Build1.IVT.
- Click Save and OK.
You are now ready to document the table.
Documenting the Table
A table summary shows general information about the table that can help users understand its contents.
- To open the Summary editor, point at Summary in the Edit menu and click File. This is a sample table summary:

To document the table:
Using the sample table summary as a guide, enter the following information:
Area | Summary Information |
Title | A description of the table |
Category | A subject area classification for the table |
Author | The table’s author |
Keywords | Words a user can enter to search for the table |
Notes | Any notes you want to associate with the table |